It can be very beneficial to see the structure of related tables at once, even before writing schemas and generating the first database tables. Viewing data in context makes it easier to spot missing fields or decide whether a dataset should be split into multiple tables.
ERDs also help with consciously designing constraints such as unique keys and foreign keys.
When the focus is on data structure rather than a specific feature, it becomes easier to apply best practices learned earlier. While creating ERDs, it is also easier to apply database design principles such as normalization, which helps avoid data redundancy and inconsistency.
Diagrams are especially useful for understanding relationship types (1–1, 1–N, N–N), which is essential for building a correct data model.
It is also worth considering indexing during the design phase, as it can significantly impact database performance later on.
Modern tools can also provide database-specific types and settings. Some of them even use AI to provide suggestions or perform grouping automatically.
There are many different tools available, varying in complexity, functionality, and pricing. Most of them offer a free version, often with limitations (e.g., 15-day trial, max 10 diagrams). It’s worth choosing based on your specific needs. Let’s take a look at some of them grouped by category.
Design and modeling
- Diagrams.net / Draw.io – completely free, browser-based, provides basic functionality
- QuickDBD
- ERDPlus
- Eraser
- ChartDB
- dbdiagram.io
Database clients with built-in designers
- DBeaver – clean interface, has a free Community Edition
- DBSchema – convenient with many helper features for fast and accurate design, but only free for 15 days
- Beekeeper Studio
- MySQL Workbench
Documentation and modeling tools
- dbdoc – mainly for documentation
- Vertabelo – professional modeling tool
- Lucidchart – professional modeling tool
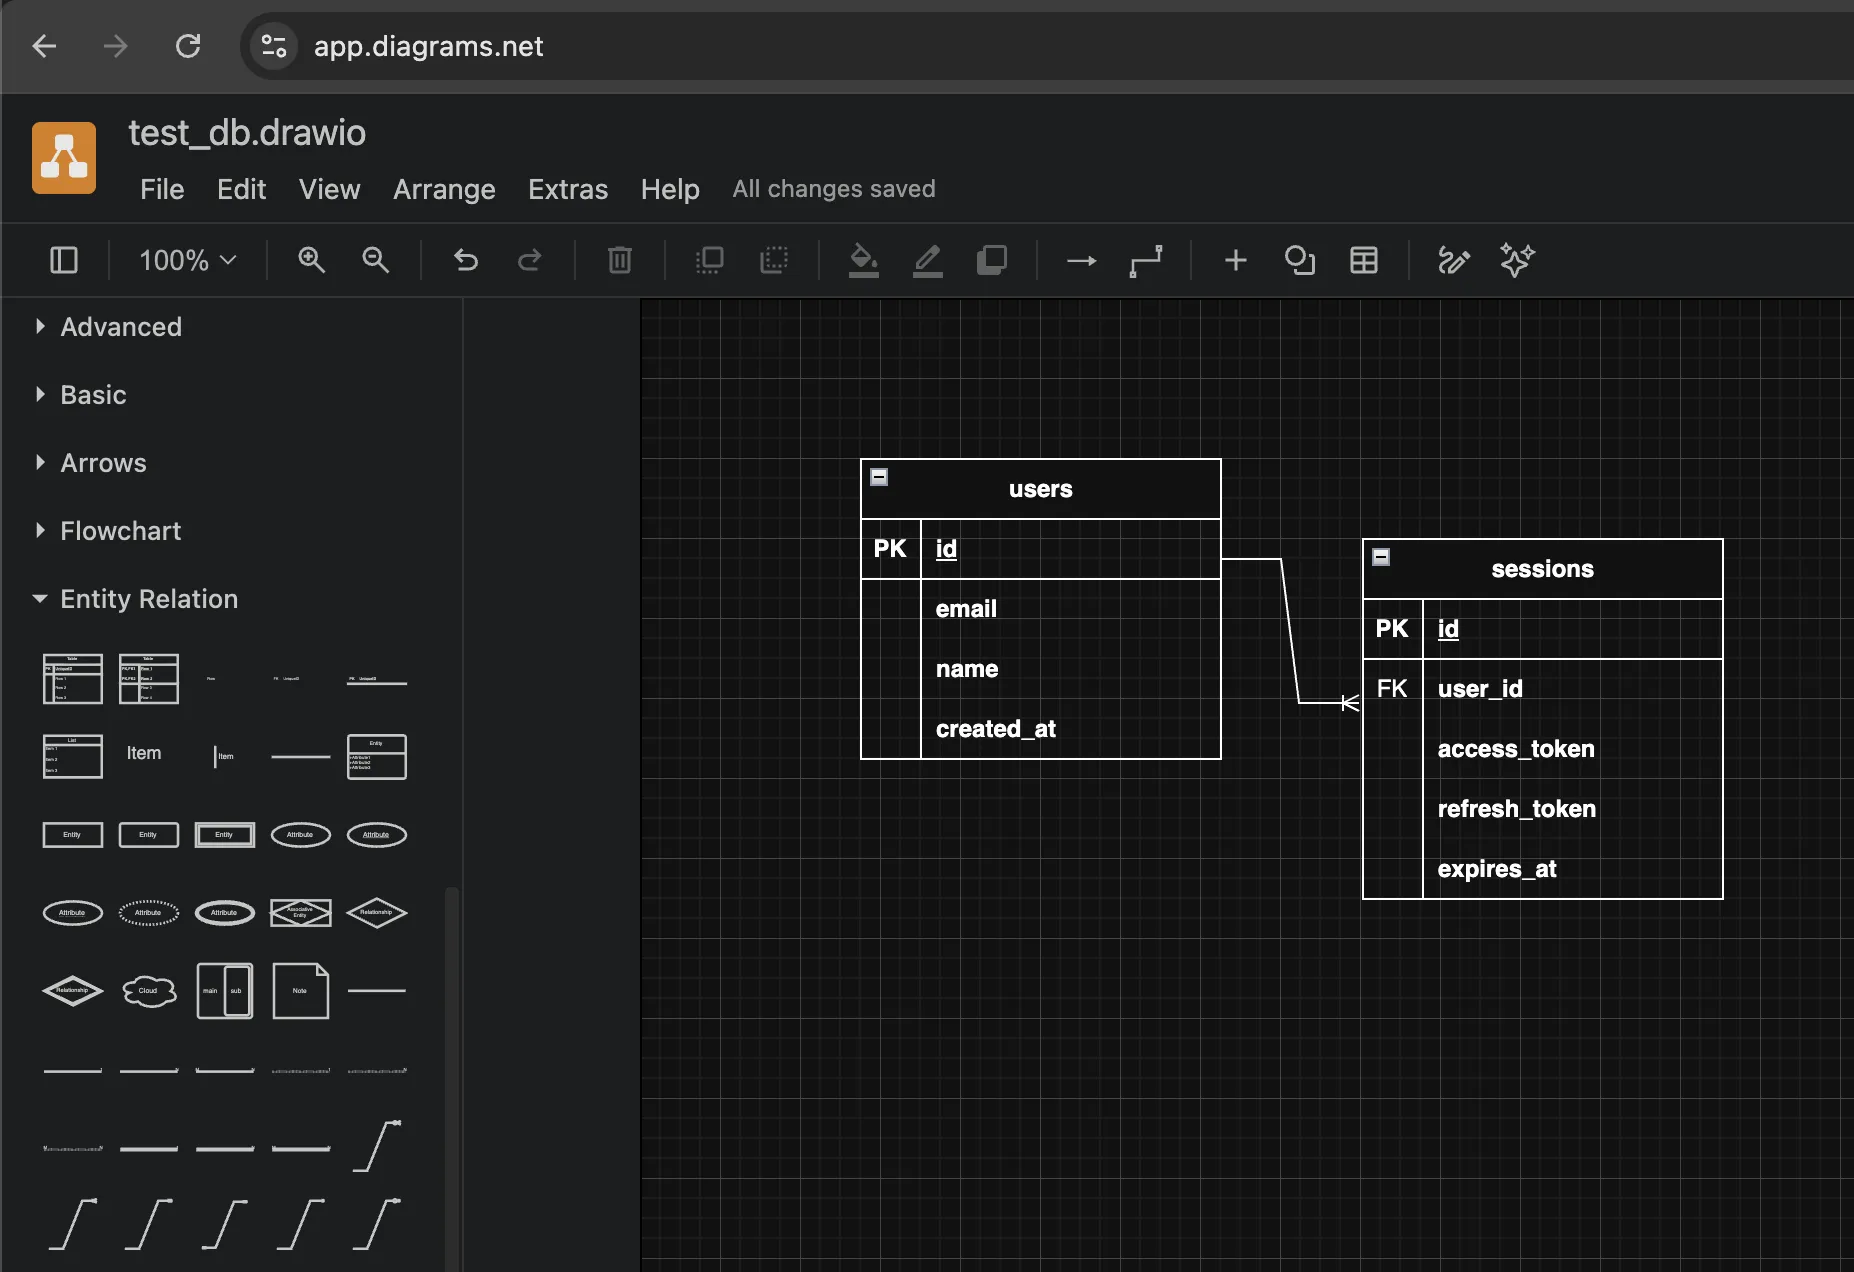
A popular tool is draw.io, mainly because it is free and easily integrates with documentation tools (e.g., Confluence). It provides predefined shapes that help create flowcharts quickly. It also includes database-specific elements under the “Entity Relation” section that can be used to create ERDs.
It is fast to work with, but it does not provide database-specific assistance and cannot export the result as SQL. Another downside for some projects is that it is an online tool, which means less control over data security compared to downloadable, offline solutions.
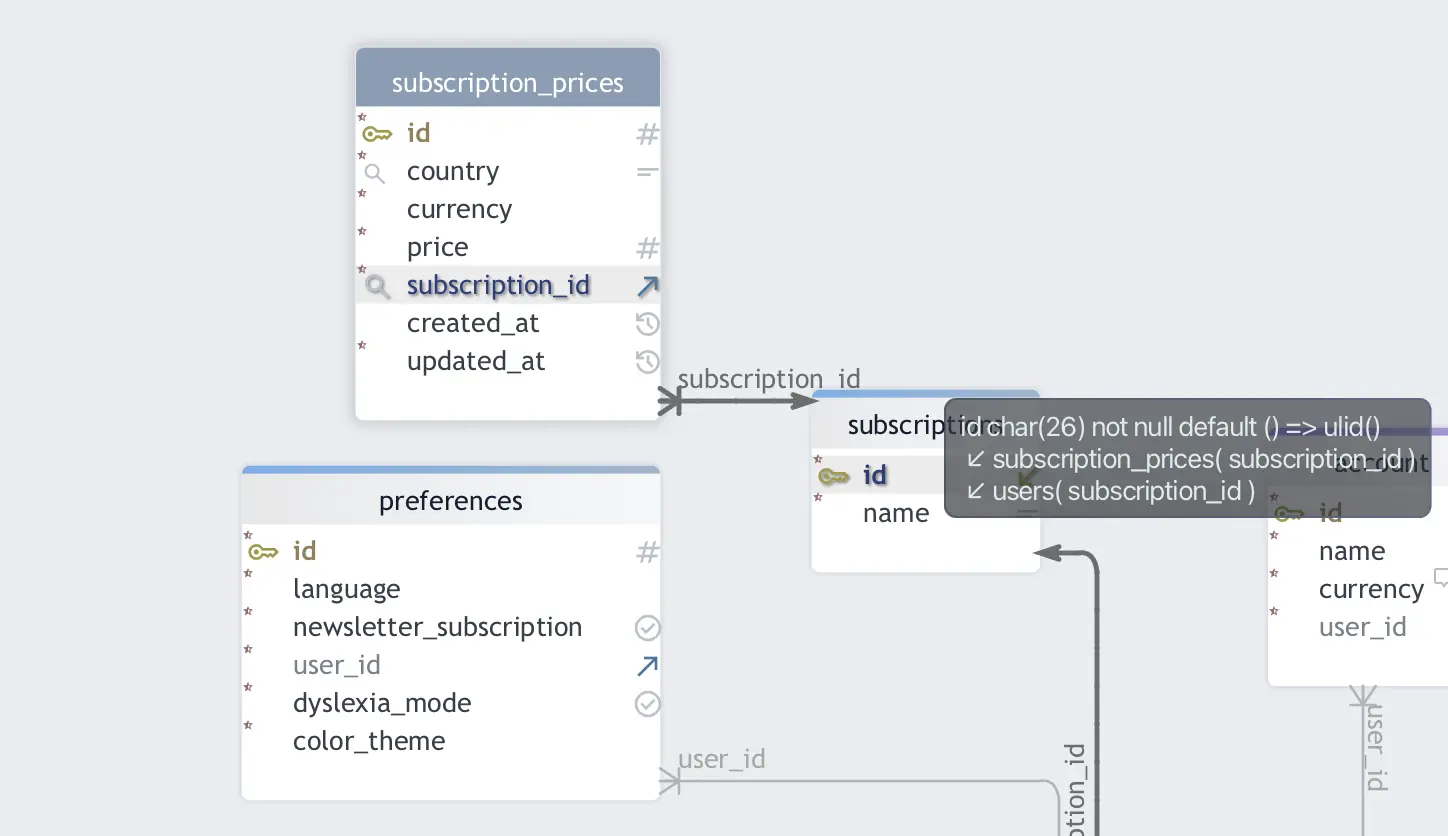
In more advanced tools, you can find a wide range of features. For example, in DBSchema, when creating a table, you get a prepared GUI. Using an “add” button, you can assign columns to the table and define properties such as NOT NULL, default values, or the GENERATED ALWAYS AS IDENTITY option.
If you are working with a database-specific project, you can select from supported types via a dropdown menu. You can also create custom types, such as enums. With drag-and-drop, you can connect primary keys to foreign keys, and the appropriate relationships (1-N, 0-N, etc.) are created automatically. When you move tables in the diagram, these relationships adjust automatically.
You can assign colors to headers, making it easier to visually group related parts. The table wizard also provides a separate tab for defining indexes. Once you are done, you can export the result as documentation or SQL code. There is also support for version control (via Git) and synchronization with a real database.
Although the interface is easy to learn, there are a few quirks. For example, users familiar with Figma might find it unusual that you can only expand the canvas by adding new elements—you cannot scroll into empty space. Another minor annoyance is that after creating a new data type, the tool exits the type view, and you have to navigate back to configure its properties.
These tools can also be used together. For example, you can create your initial design in a feature-rich tool (e.g., DBSchema) during the trial period. Then export it as documentation (PDF/Markdown/DBS) and as SQL, which can serve as a guideline (not copy-paste) for your backend schemas.
Once your schemas are implemented and the tables are created, you can use a completely free tool (e.g., DBeaver Community Edition) to always view the latest version of your database structure.
As a concrete example, in DBeaver Community Edition (26.0.2), I found the diagram view under: right-click on the public schema → View Schema → Diagram tab. This may vary depending on the version.
In DBSchema (10.1.3), SQL export is available under the Schema menu → Export Schema & Data.
As a final thought: turning an 8–10 page document into a comprehensive visual diagram in just a few hours can be a really satisfying experience. 🙂