Why?
Monitoring helps us detect when something is wrong. It answers predefined questions (for example: “Is the service running?”). Observability provides greater control because it gives us visibility into the path that led to a failure, allowing us to investigate issues for which we did not create dashboards or alerts in advance.
By collecting the right signals, we can reduce incident resolution time, plan scaling efforts more effectively, and quickly detect problems introduced by new deployments.
Observability Signals
Observability data is commonly divided into three main categories: metrics, logs, and traces.
Metrics
Metrics are aggregated values that can either continuously increase or fluctuate over time. The number of visitors during a given month is a cumulative value that cannot decrease. The average latency of API calls, however, can change depending on whether we improve or degrade performance.
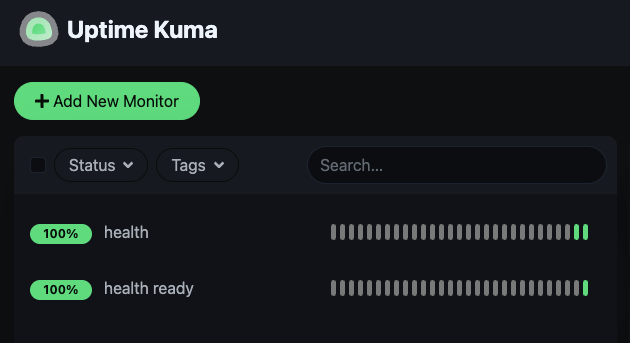
A popular open-source solution for collecting metrics is Prometheus, while Grafana provides powerful visualization capabilities. The availability of endpoints and the status of workflows can be monitored through Uptime Kuma. All three tools can be self-hosted.
Logs
Logs provide detailed contextual information for investigations. As a result, storing them is generally more expensive than storing metrics. When designing logs, it is worth prioritizing machine readability by using structured key-value pairs instead of plain text messages.
Common log levels include:
- DEBUG: The most detailed level. Usually not recommended in production unless it is required for a specific troubleshooting effort. Primarily useful during development.
- INFO: Describes normal application behavior and events.
- WARN: Indicates a potential issue that is not yet an error.
- ERROR: Signals a problem that requires attention because something did not work as expected.
- FATAL: Indicates a service failure or shutdown.
A popular choice for log aggregation is Loki. In larger environments, the Elasticsearch and Kibana stack is also commonly used.
Traces
Traces are one of the key building blocks of distributed systems. We associate an identifier with a request or business process and propagate it across services, making it possible to follow the entire execution path and identify where a problem occurred.
Tools such as Jaeger and Tempo help collect and visualize traces.
For smaller applications or monolithic backends, distributed tracing is not always necessary. The cost of implementing and maintaining it may outweigh its benefits. However, in a world where some projects start with a dozen microservices from day one, it is worth understanding the concept. 🙂
SLI, SLO, and SLA
SLI (Service Level Indicator)
Examples include availability, latency, and correctness. An SLI is any metric that reflects the user’s experience of a service.
SLO (Service Level Objective)
An SLO defines the target value for a given SLI that we are willing to invest effort into achieving. The higher the target, the more robust the architecture and observability practices need to be.
For example, 99.9% availability means that a service may be unavailable for no more than 43.2 minutes per month.
SLA (Service Level Agreement)
An SLA defines the commitments made to users or customers. Failing to meet these commitments may result in legal or financial consequences.
Because of this, SLA targets are typically set lower than their corresponding internal SLOs.
Sentry
When discussing application monitoring, many developers immediately think of Sentry. Although it is a commercial product, it offers a free tier that is often sufficient for smaller projects.
Sentry is primarily focused on error monitoring, but it continues to expand its observability-related capabilities. Integration is straightforward because it supports a wide range of application types and frameworks.
A few things worth paying attention to:
- Store the DSN as an environment variable.
- Configure source maps for code that becomes difficult to read after build and minification. In this case, the authentication token should also be treated as a secret. For simple setups, Sentry can generate a
.sentryclircfile automatically. In more complex codebases, some manual configuration may be required. Proper source map configuration allows Sentry to identify the original source code responsible for an error. - If you use a custom
global-exception-filter, integrate Sentry there as well. (For NestJS, place@SentryExceptionCaptured()above the catch method.) - The default initialization already captures unhandled errors automatically. Manual reporting is only necessary when you want to provide additional context.
However, Sentry alone cannot cover many infrastructure-level metrics, and in a complex service architecture it may become either insufficient or expensive.
Smaller Projects
For smaller projects, Sentry alone may be enough.
For somewhat larger, business-critical applications, it is often worth introducing Uptime Kuma, Prometheus, and Grafana.
Larger Projects
In larger environments (for example, more than ten services), where requests travel through many components, more advanced tracing becomes increasingly valuable.
There are many tools available for tracking request flows. However, to avoid vendor lock-in and make it easier to switch between observability platforms, it is often beneficial to build on OpenTelemetry.
OpenTelemetry
OpenTelemetry is an open standard and toolkit that provides a unified way to collect and export metrics, logs, and traces to different observability platforms such as Prometheus, Grafana, Datadog, and New Relic.
One of its biggest advantages is the ability to correlate logs, metrics, and traces, making it easier to investigate incidents from multiple perspectives.
Conclusions
Introducing additional observability tooling requires both time and operational investment. However, the right tools can save countless hours of troubleshooting and make systems significantly easier to operate in the long run. 🙂